
Sold prices A to Z
Land Registry sold prices, by postcode
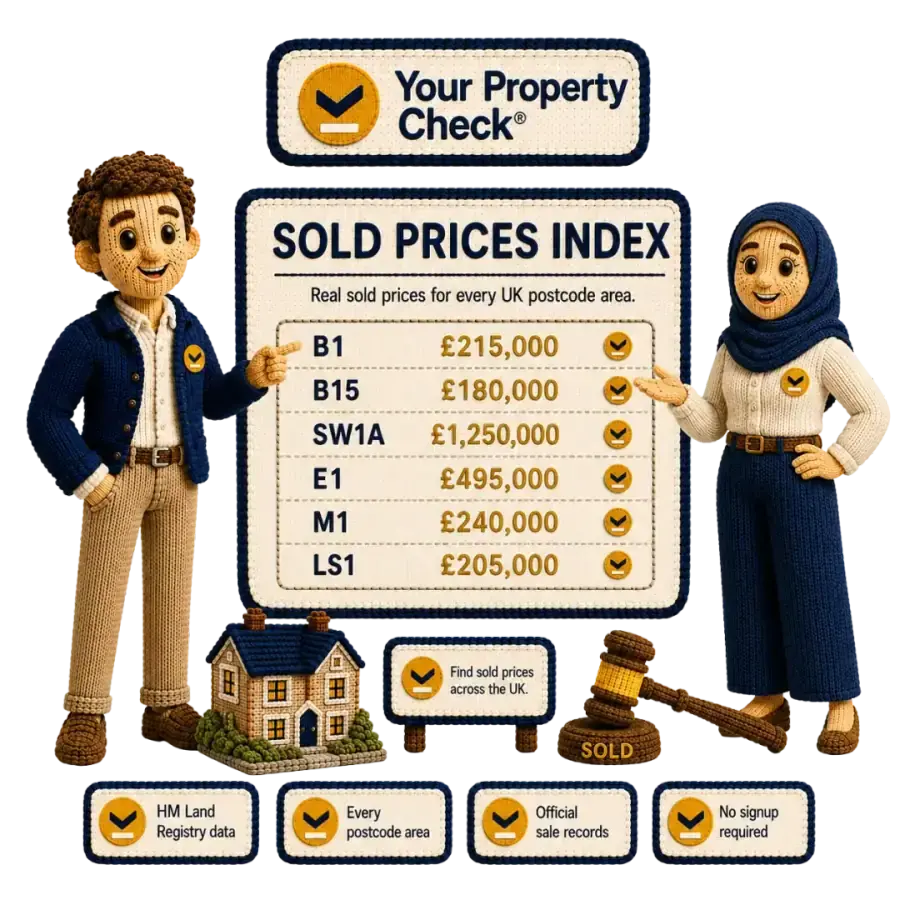
Search by postcode to see what homes have actually sold for, from the official HM Land Registry record that goes back to 1995. Each postcode page shows the typical price, the lower-to-upper range, a 24-month trend, a property-type split and the recent transactions. Or browse every UK postcode area A–Z below.
Data from HM Land Registry Price Paid Data, up to 30 September 2026
Looking for charts, sortable tables and saved searches? That's the interactive Sold Prices tool for the same data on a different page.
- HM Land Registry
- Real transactions
- Data to 30 September 2026
Or browse every UK postcode area below ↓
Browse the full index
Every UK postcode area, alphabetically
Search by prefix, postcode or city, or jump to a letter to skim the index.
105 of 105 areas
Two ways to use the data
This page is the A–Z directory. The tool is interactive.
You're on the directory: every UK postcode area as its own static page, optimised for browsing and search. The Sold Prices tool takes a postcode you already know and gives you charts, sortable transaction tables, a property-type breakdown and a save button: same data, fully interactive.
How to read the figures
Typical price, range and the 24-month trend
Every postcode page leads with the typical price, which is the median of the recorded sales: half were for less, half for more. Next to it sits a range from the lower end (10th percentile) to the upper end (90th percentile), so a few unusually cheap or expensive sales do not distort the picture. We show a range rather than one number because no single figure describes every home in a district.
The 24-month trend plots the typical price by quarter. Quarters with few sales move around more, so the page also shows how many sales each figure rests on. The latest months are always incomplete: HM Land Registry says the gap between a sale and its registration typically ranges between 2 weeks and 2 months.
Data from HM Land Registry Price Paid Data, up to 30 September 2026, covering 2,269 postcode districts in this directory. It contains public sector information licensed under the Open Government Licence v3.0. Last reviewed 16 October 2026 by the Your Property Check team. Sold prices describe what has happened; they are not a valuation. For your own home, try the free house valuation or read how we value.
Cannot find a recent sale? Why a house sale may not show in the sold price data explains the usual reasons.
Land Registry sold prices: common questions
- What are Land Registry sold prices?
- They are the prices recorded in HM Land Registry’s Price Paid Data, which GOV.UK says is derived from all residential property transactions registered with HM Land Registry since January 1995. Each record is a real sale, not an estimate or a valuation.
- How do I look up sold prices by postcode?
- Type a postcode into the box at the top of this page, or browse the A–Z list of postcode areas. Each postcode district page shows the typical (median) price, the lower-to-upper range, a 24-month trend by quarter, a split by property type and the recent transactions.
- How up to date is the data?
- The figures here run up to 30 September 2026. HM Land Registry says the gap between a sale and its registration typically ranges between 2 weeks and 2 months, so the most recent two months of any dataset are incomplete.
- Why is a recent sale not showing?
- Usually because it has not been registered yet, given the 2-week to 2-month gap above. HM Land Registry also says the data leaves out sales that were not for value and sales that have not been lodged with it. Our short guide explains the common reasons. Read the guide.
- What do the typical price and range mean?
- The typical price is the median: half the recorded sales were for less and half for more. The lower-to-upper range runs from the 10th to the 90th percentile, so it leaves out the cheapest and dearest tenth of sales. Both describe a whole postcode district, not any single home.
- Is this a valuation of my home?
- No. Sold prices show what similar homes in an area have sold for, as a range. Your own home depends on its condition, size and exact street. Our free valuation shows the working behind a range, and the method is published.
- Where can I find Land Registry sold prices?
- HM Land Registry publishes them as Price Paid Data on GOV.UK, and this page lets you search that data by postcode district. Each result is a recorded sale, with the price, date and property type. Registration lags the sale, so very recent sales can take up to two months to appear.
- Are Land Registry sold prices free to look up?
- Yes. Price Paid Data is published by HM Land Registry under the Open Government Licence, and searching it here is free with no sign-up. You can see typical prices, the range, the trend and recent sales for a postcode district, with the source named on the page.
- Do Land Registry sold prices show the exact price someone paid?
- Each record shows the price recorded when the sale was registered. It can differ from the asking price, and HM Land Registry notes that sales not made for value and unregistered sales are left out. It is a record of what was paid, not a valuation of any home today.